Technology
World-class technology
backed by science
Enterprise-grade proprietary data platform performing
real-time power flow analysis and forecasting at global scale.
Data Pipeline
State-of-the-art
real-time data processing
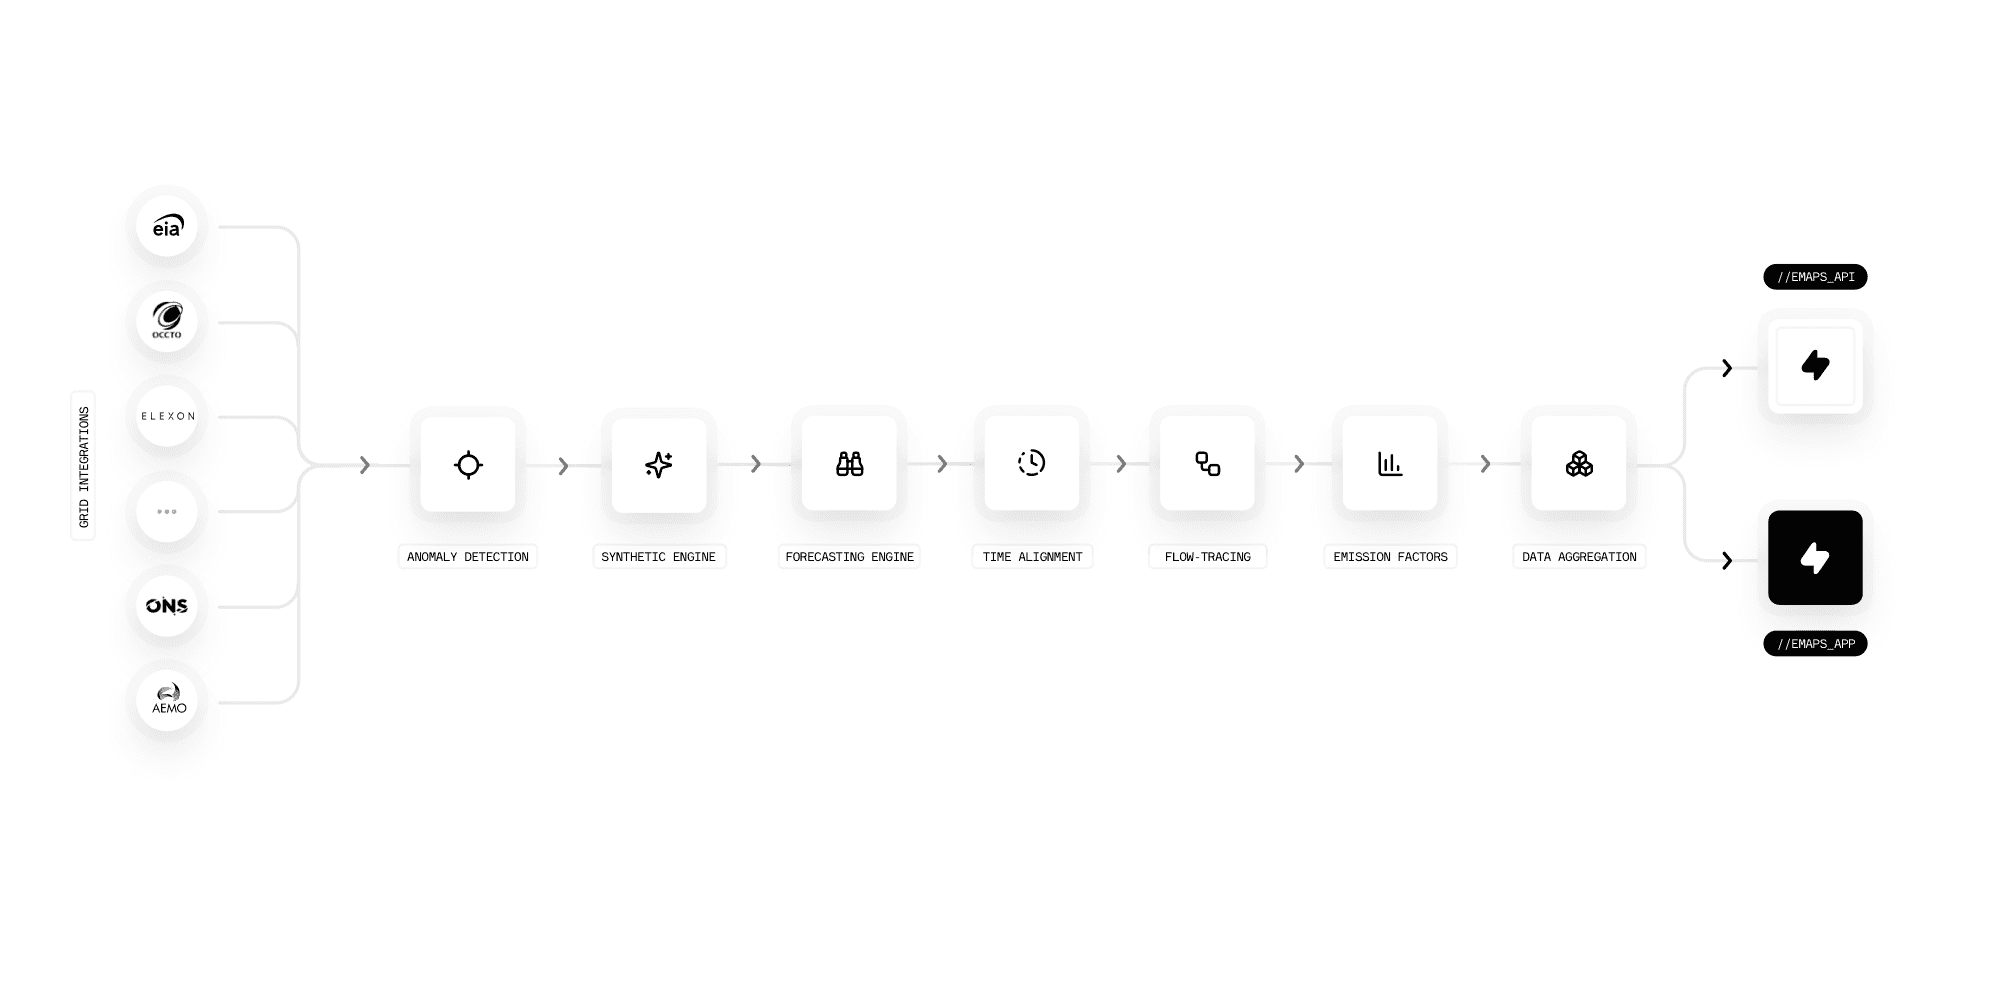
The Electricity Maps platform processes and aggregates live electricity grid data, including energy production, consumption, and electricity flows, leveraging advanced machine learning algorithms and extensive integrations with grid operators worldwide to provide highly accurate calculations. It dynamically models electricity flows by leveraging the flow-tracing methodology.
Data acquisition
Ingesting billions of datapoints every day
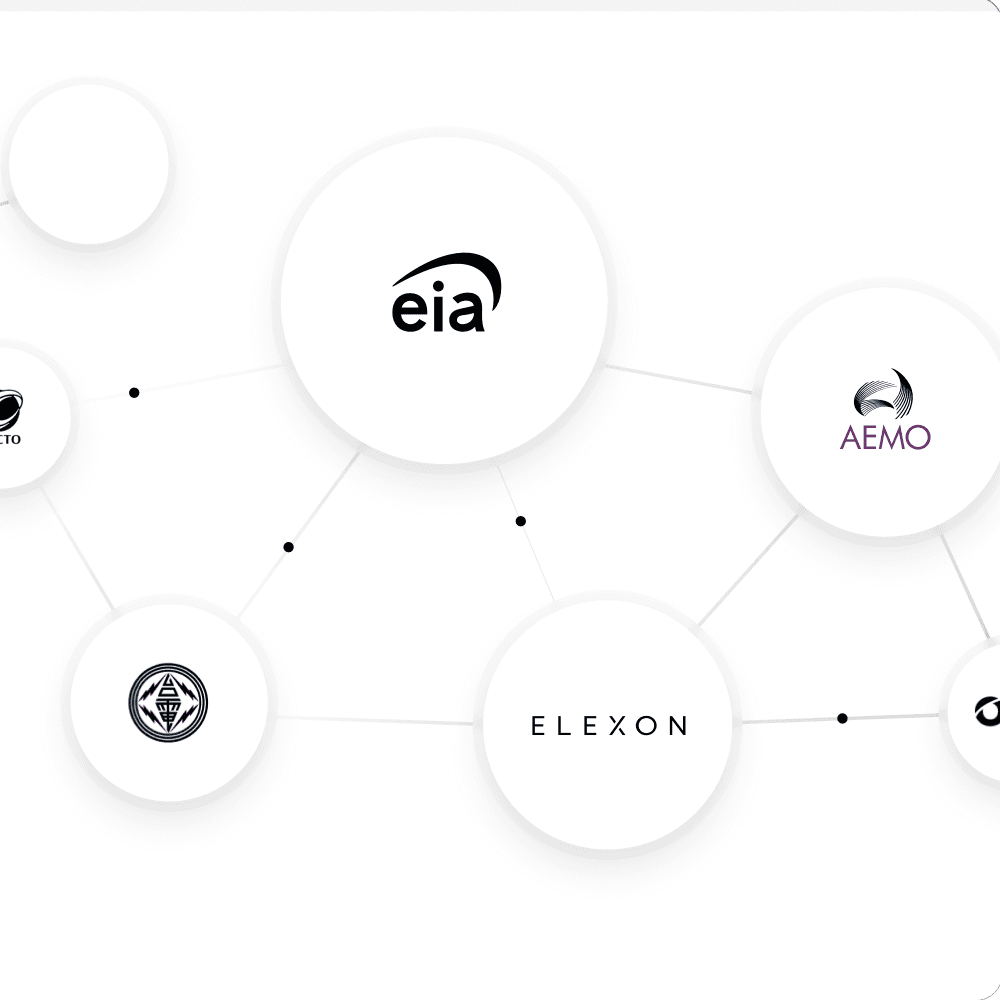
The Electricity Maps data platform integrates with 100+ grid operators worldwide. It also integrates with market operators and weather providers in order to power its forecasting engine, thus ingesting billions of datapoints every day.
Highlights
100+ sources
Integrates with 100+ grids worldwide in order to deliver the highest geographical coverage, spanning more than 350 zones.
Always up to date
Automatic refetch of data after days, weeks, and months, to ensure consolidated data is gathered and made available.
Anomaly detection
Detecting & cleaning anomalies automatically
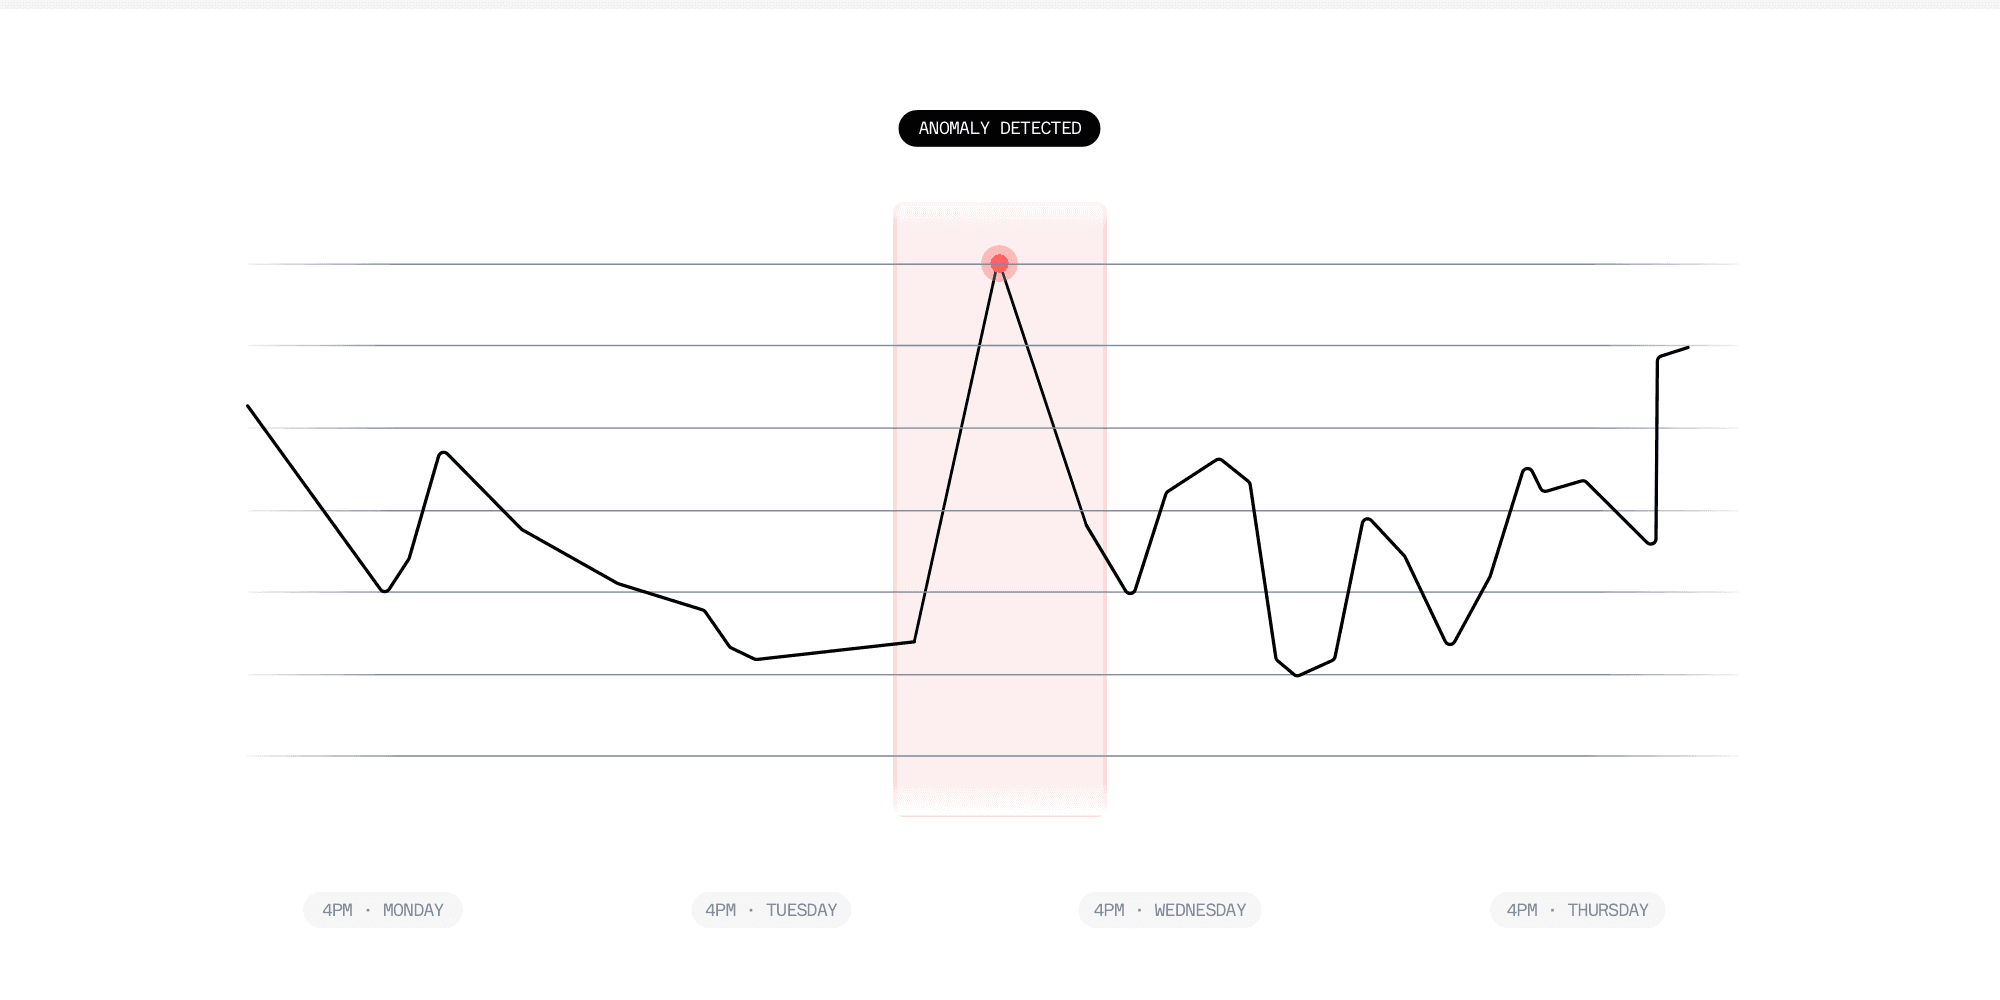
Data from grid operators can often be delayed, missing, or incorrect. Specialised anomaly detection algorithms detect the presence of incorrect data, which is updated by machine learning based synthetic data models, thus ensuring the highest availability and accuracy of data.
Highlights
Automated quality checks
Continuous and automatic data checks to validate all collected data. Invalid data is removed and replaced by synthetic data.
Synthetic estimation models
Multiple machine learning based estimation models used to generate synthetic data in the presence of invalid data, data delays, data gaps
Forecasting Engine
Predicting the state of the grid for the next days
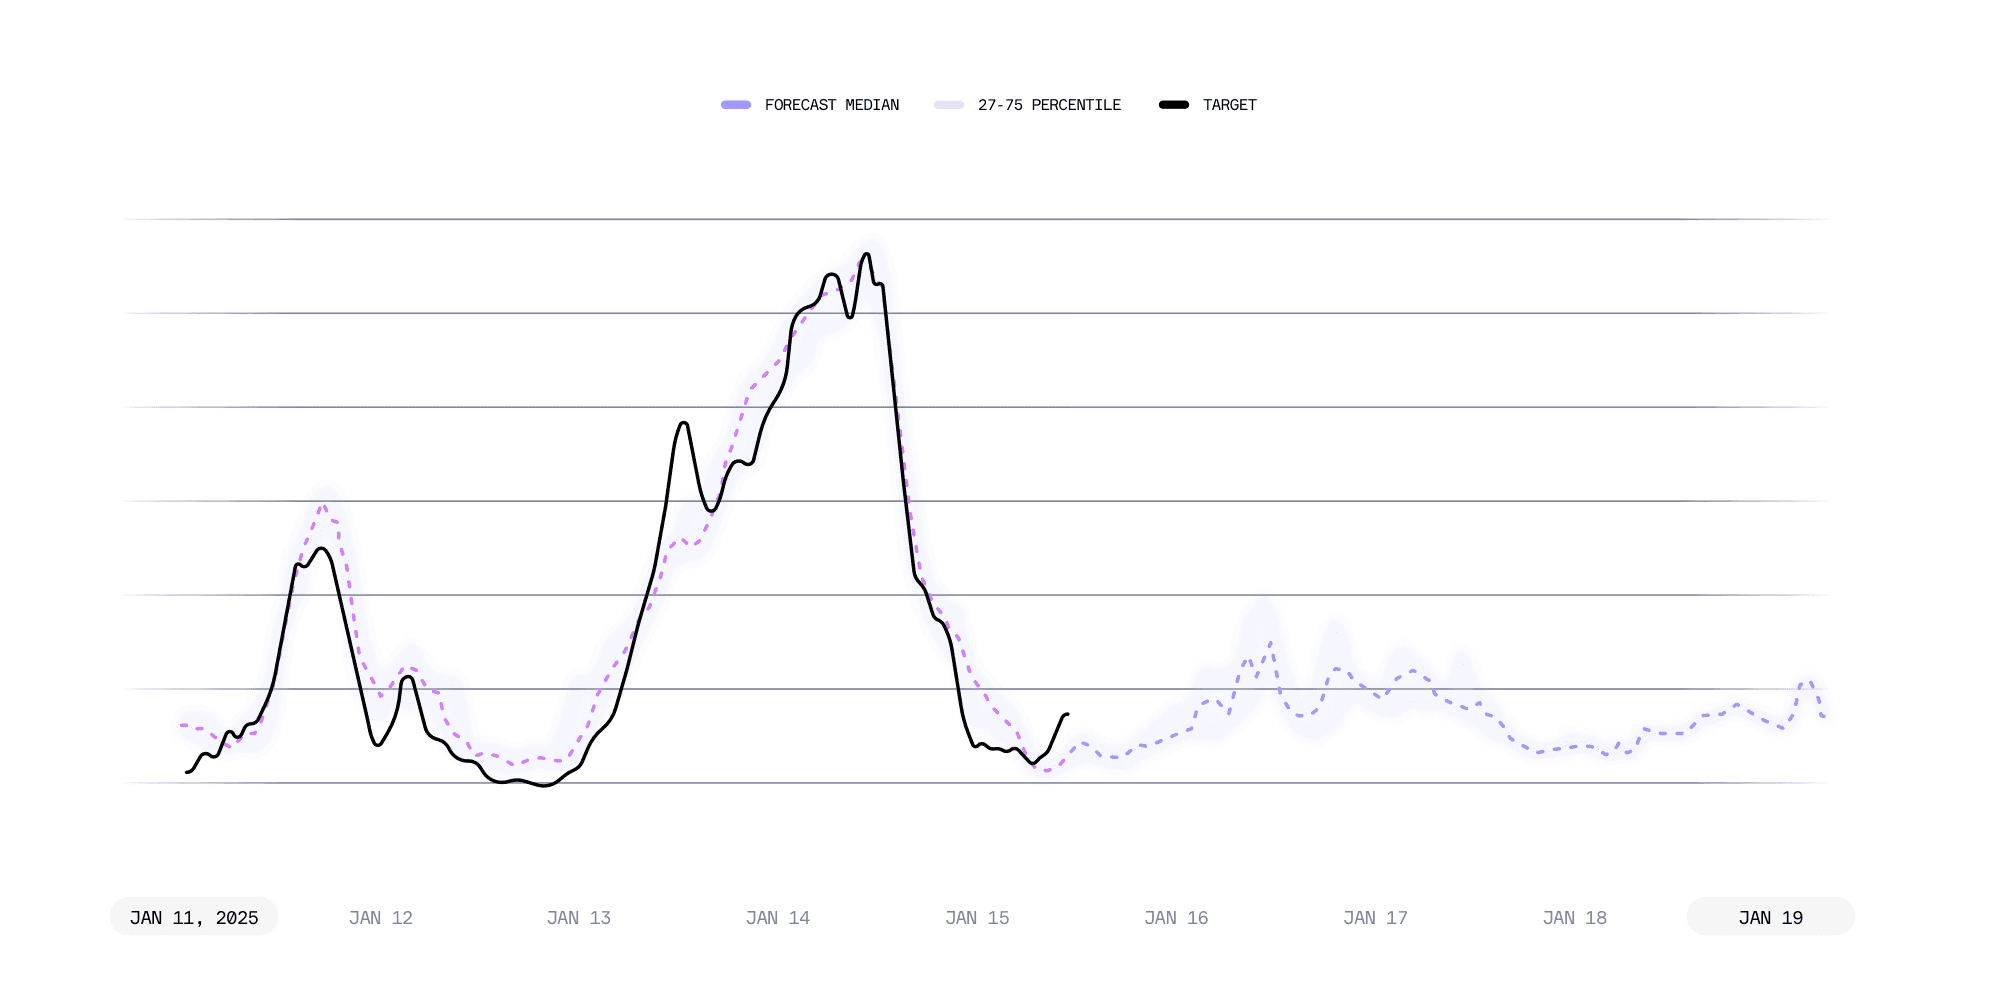
The full state of the electricity grid, including electricity flows, day-ahead prices, electricity mix and carbon intensity, is forecasted up to 72 hours ahead. This is achieved using a mix of regression and tree-based methods, regularly retrained and backtested to ensure the highest performance.
Highlights
Automatic Retraining and Monitoring
Forecast model are continuously retrained, backtested and monitored in real-time.
Performance Reports
Performance reports are available through a special dashboard made available to our customers.
Data acquisition
Tracing back the origin of electricity
Electricity used in one location might originate from a completely different place, due to the presence of transmission lines that transmit electricity across large distances. To properly attribute emissions in one geographical region, we trace the path of electricity back to its original source. This ensures we account for emissions from the actual power plants that generated the electricity, rather than just the country where it’s consumed.
Highlights
Increased accuracy
More than 10% of emissions come from imported electricity on average, which causes errors in the 10-15% range, and up to 90%.
Peer reviewed
Implemented in Electricity Maps since 2016, the flow-tracing methodology has been peer-reviewed and is a globally recognised algorithm.
